Onboarding project | Country Delight

What does Country Delight Solve for?
Country Delight solves for the problem of delivering fresh, high-quality dairy and other farm produce directly to consumers’ doorsteps. Some of them can be listed below:
- Ensures that consumers receive farm-fresh, unadulterated products
- Emphasizes transparency in its supply chain, allowing customers to trace the origin of their products, ensuring trust and reliability
- Provides convenience, saving customers time and effort typically spent on sourcing fresh groceries
- Focus on natural, preservative-free products aligns with the growing consumer demand for healthier food options
Value Propositions that Country Delight brings in
- Farm-to-Doorstep Freshness
- High Quality and Purity
- Transparency, Trust & Convenience
- Sustainability and Ethical Sourcing
Who are Country Delight’s Competitors?
- Farm-to-Home Dairy Delivery: Akshayakalpa, Milk Mantra
- Organic and Fresh Produce Delivery: Naturolax, BB Daily
- Subscription-Based Grocery Delivery**:** Supr Daily, BigBasket
With Country Delight, experience the true essence of farm-fresh goodness, delivered right to your doorstep—because your family deserves nothing less than the purest and freshest.
Ideal Customer Profiles (ICPs)
Here would be the broad category of ICPs that I would look to for this onboarding teardown:
- Health-Conscious Families
- Urban Professionals
- Eco-Conscious Consumers
- Food Enthusiasts and Home Cooks
- Senior Citizens

I believe the Health-Conscious Families segment would likely provide the best balance of revenue and coverage for onboarding. The reasons can be:
- These families typically consume larger quantities of dairy products, which means consistent, repeat orders.
- This segment is willing to pay a premium for high-quality, fresh, and chemical-free products, contributing to higher revenue per customer.
- Targeting families can open up multiple distribution channels (online and offline), including community groups, schools, and residential societies.
- The market for health-conscious families is vast, especially in urban and semi-urban areas where the demand for safe and nutritious food is growing rapidly.
We can also reap in a few strategic benefits out of these families. This can lead to a solid continuous revenue stream. The yare likely to put in word of mouth and improve the brand awareness.
I decided to talk to 2 such users who are health conscious as well as live in urban areas. Let’s see what the users had to say:

Let’s see what the ICPs have an opinion about Country Delight:

Jobs to be Done
Let’s use the framework of JTBD to see how Country Delight fares:
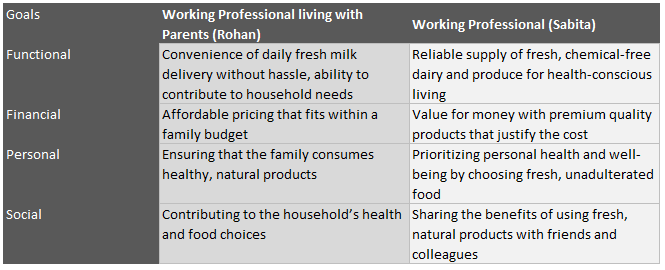
Based on the ICP that I have chosen, at this point I believe it is more about fulfilling their functional goals over financial goals.
Onboarding Teardown
I am attaching the PDF for the teardown.
Onboarding Teardown- Country Delight.pdf
Activation Metric
The ways I look at my ICP and what the product has to offer, I can think of the below activation metrics:
- 50% of users who order their first product within 3 days of app download. This will show how quickly people are adopting. It will also indicate strong initial interest. Many just download the app and do nothing. So, if even 50% make their first purchase, then it should be a great achievement.
- 30% of users who set up a subscription plan within 10 days of registration. Subscriptions are crucial for long-term customer retention and revenue. Tracking how soon users commit to a subscription indicates the ease of use and attractiveness of the subscription model. Again 30% would be a good number.
- 20% of users who refer a friend within 15 days of their first purchase. Referrals are a sign of customer satisfaction and trust. Though we would depend a bit more on these referrals, but seeing a conversion of 20% would also be a good metric.
- 80% of users who engage with the app at least 5 times within 7 days of their first purchase. Regular engagement with the app is a sign of ongoing interest and a potential for repeat purchases. This measures app stickiness.
- 75% of users who make a repeat purchase within 3 days of their first purchase. A repeat purchase indicates customer satisfaction and increases the likelihood of long-term loyalty.
Overall Metrics to Track
| Metric | Explanation | Reasoning |
D1 Retention | (Number of users who return on Day 1 / Total users on Day 0) * 100 | Measures the percentage of users who return to the product on the first day after signup. |
D7 Retention | (Number of users who return on Day 7 / Total users on Day 0) * 100 | Measures the percentage of users who return to the product on the seventh day after signup. |
D30 Retention | (Number of users who return on Day 30 / Total users on Day 0) * 100 | Measures the percentage of users who return to the product on the thirtieth day after signup. |
DAU (Daily Active Users) | Count of unique users who visit the platform on a given day. | Tracks the number of active users on a daily basis. |
MAU (Monthly Active Users) | Count of unique users who visit the platform in a calendar month. | Tracks the number of active users on a monthly basis. |
Subscription Rate vs. Retention | (Number of new subscriptions / Total users) * 100 | Compares the rate of new subscriptions to overall user retention, assessing the platform's growth. |
Acquisition Source | Track the source of user acquisition for each user (e.g., direct, referral, social media, etc.) using UTM parameters or source tracking tools. | Identifies where users are coming from and which acquisition channels are most effective. |
Average Order Value (AOV) | Total Revenue / Total number of Orders | AOV tracks the average amount spent by customers per order. Growth suggests that customers are buying more products or higher-value items |
Brand focused courses
Great brands aren't built on clicks. They're built on trust. Craft narratives that resonate, campaigns that stand out, and brands that last.


All courses
Master every lever of growth — from acquisition to retention, data to events. Pick a course, go deep, and apply it to your business right away.


Explore courses by GrowthX
Built by Leaders From Amazon, CRED, Zepto, Hindustan Unilever, Flipkart, paytm & more
Course
Advanced Growth Strategy
Core principles to distribution, user onboarding, retention & monetisation.
58 modules
21 hours
Course
Go to Market
Learn to implement lean, balanced & all out GTM strategies while getting stakeholder buy-in.
17 modules
1 hour
Course
Brand Led Growth
Design your brand wedge & implement it across every customer touchpoint.
15 modules
2 hours
Course
Event Led Growth
Design an end to end strategy to create events that drive revenue growth.
48 modules
1 hour
Course
Growth Model Design
Learn how to break down your North Star metric into actionable input levers and prioritise them.
9 modules
1 hour
Course
Building Growth Teams
Learn how to design your team blueprint, attract, hire & retain great talent
24 modules
1 hour
Course
Data Led Growth
Learn the science of RCA & experimentation design to drive real revenue impact.
12 modules
2 hours
Course
Email marketing
Learn how to set up email as a channel and build the 0 → 1 strategy for email marketing
12 modules
1 hour
Course
Partnership Led Growth
Design product integrations & channel partnerships to drive revenue impact.
27 modules
1 hour
Course
Tech for Growth
Learn to ship better products with engineering & take informed trade-offs.
14 modules
2 hours
Crack a new job or a promotion with ELEVATE
Designed for mid-senior & leadership roles across growth, product, marketing, strategy & business


Learning Resources
Browse 500+ case studies, articles & resources the learning resources that you won't find on the internet.

Patience—you’re about to be impressed.